UX Designer Salary in Jurupa Valley, CA: $84,332 (2026)
Quick Answer:A full-time ux designer in Jurupa Valley, CA earns a median $84,332/year (≈ $40.55/hour) in nominal terms for 2026 — projected from BLS OEWS 2025 (SOC 15-1255). Once you factor in Jurupa Valley's price level (13% above national, BEA RPP 113.1), that paycheck buys what $74,564 would nationally. Nominal pay sits 0.3% above the California state average.
Based on BLS state-level estimates · View source
In the wake of significant layoffs in the tech sector during 2023 and 2024, the job market for UX designers in Jurupa Valley, CA, has shown resilience. As of 2026, the projected median annual salary for these professionals is $84,332, slightly above the national median of $83,320. Local figures reveal a broad salary range from $48,913 at the 10th percentile to $130,715 at the 90th percentile, illustrating the varied levels of compensation based on experience and company type. These estimates are drawn from state-level BLS data and regional cost adjustments, reflecting the unique economic conditions in Jurupa Valley. The local market appears well-positioned as it adapts and absorbs the influx of talent previously impacted by industry shifts, making this an interesting time for aspiring UX designers considering opportunities in the area.
About the Jurupa Valley Market
Salary estimated from California average ($142,900) adjusted for local cost of living.
Salary Breakdown
| Percentile | Annual | Hourly |
|---|---|---|
| Entry Level (P10) | $48,913 | $23.51 |
| Lower Range (P25) | $60,720 | $29.19 |
| Median (P50)(typical) | $84,332 | $40.55 |
| Upper Range (P75) | $107,945 | $51.89 |
| Top Earners (P90) | $130,715 | $62.84 |
Median Salary Position
1.21% above the national average
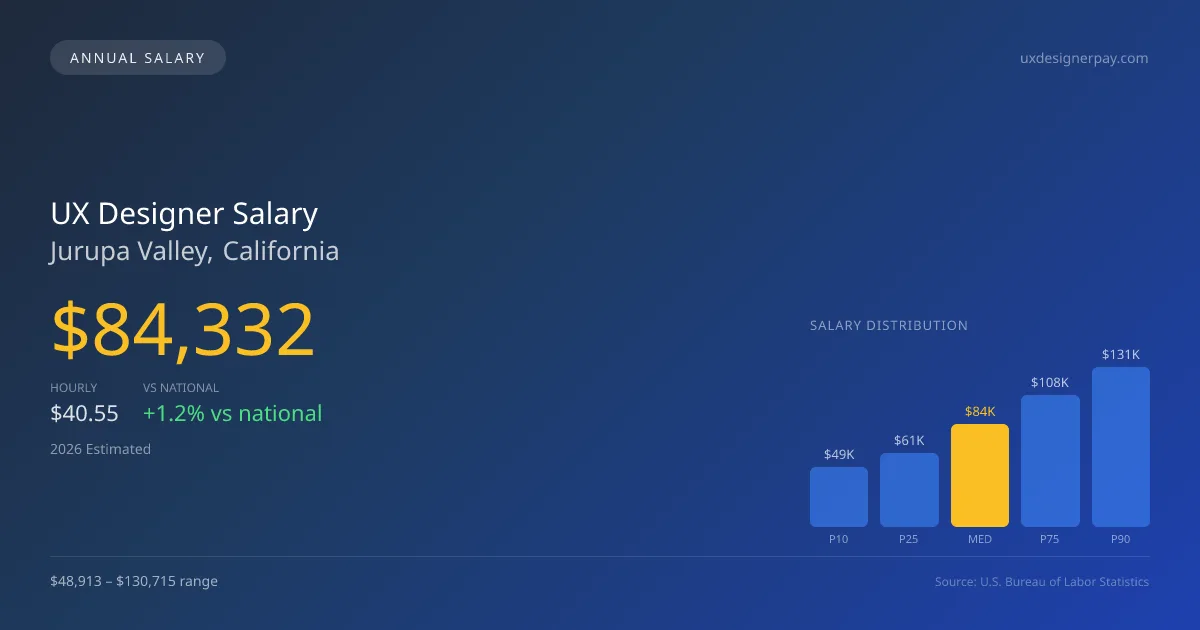
2026 Salary Percentile Distribution in Jurupa Valley
In Jurupa Valley, CA, the ux designer salary spread from the 10th to 90th percentile is $81,802 (2026 est.). At $84,332, the local median is 1.21% above the national median of $83,320.
Salary Calculator
At 40 hours/week in Jurupa Valley: You'd be in the lower-middle range
How Jurupa Valley UX Designer Pay Compares
Jurupa Valley median: $84,332/year (2026)
| Compared To | Median Salary | Jurupa Valley Pays |
|---|---|---|
| California Average | $84,080 | +0.30% more |
| National Average | $83,320 | +1.21% more |
UX Designers in Jurupa Valley, CA earn a median of $84,332 per year (2026 est.), which is 1.21% higher than the national median of $83,320 and 0.30% above the California state average of $84,080.
Cost-of-Living Adjusted Salary
Jurupa Valley has a cost of living 13.10% above the national average.
Adjusted salary = nominal × (100 / CoL index). CoL index: 100 = national average.
Jurupa Valley, CA has a cost-of-living index of 113.1 (above the national average of 100). While the nominal salary of $84,332 is competitive, the higher cost of living reduces purchasing power to an effective $74,564 — a 11.58% reduction.
Compare Purchasing Power
Select a city to see how your salary compares after cost of living
Select a city above to compare purchasing power
2021 BLS Actual
$60,646
2025 BLS Actual
$78,948
2026 Current Est.
$84,332
2021–2027 Growth
+48.5%
Salary Trajectory for UX Designers in Jurupa Valley (2021–2027)
2021–2025: actual BLS OEWS data for this metro area. 2026+: CAGR 6.82% projection.
| Year | Annual Salary | Status |
|---|---|---|
| 2021 | $60,646 | Actual |
| 2022 | $63,189 | Actual |
| 2023 | $74,803 | Actual |
| 2024 | $162,041 | Actual |
| 2025 | $78,948 | Actual |
| 2026(current) | $84,332 | Estimated |
| 2027 | $90,084 | Projected |
Based on 5 years of BLS OEWS data for the Jurupa Valley metropolitan area, the median ux designer salary grew 30.2% from $60,646 (2021) to $78,948 (2025). At a 6.82% compound annual growth rate, salaries are projected to reach $90,084 by 2027 — a total increase of $29,438 (48.54%) from 2021.
Note: Historical values (2021–2025) are actual BLS OEWS figures for the Jurupa Valley metropolitan area, sourced from annual Occupational Employment and Wage Statistics surveys. 2026–2026 figures are current estimates, and 2027 values are projections, calculated using a 6.82% CAGR derived from 5-year BLS historical data. Actual salaries may vary based on employer, experience, certifications, and local market conditions.
Salary by Experience Level
| Experience | Estimated Salary Range |
|---|---|
| 0-2 years (New Graduate) | $48,913 – $60,720 |
| 3-5 years (Mid Career) | $60,720 – $84,332 |
| 5+ years (Experienced) | $84,332 – $107,945 |
| 10+ years (Top Earner) | $107,945 – $130,715 |
UX salary ranges estimated from BLS percentile data. Individual ux designer compensation varies by employer, certifications, and specialization.
UX Designer Job Market in Jurupa Valley
Currently, 24 UX designers are employed in Jurupa Valley, showcasing a niche but vibrant job market. However, the cost of living index at 113.1 indicates that living expenses are higher than the national average, impacting take-home pay. Among local employers, tech giants and well-established agencies tend to offer the highest compensation packages, particularly those with a focus on cutting-edge design work. The pay disparity is influenced by several factors, including the tier of the company—higher compensation is typically seen at FAANG firms compared to mid-tier tech and non-tech companies—as well as specialization in areas like research versus product design. To maximize earnings, UX designers in Jurupa Valley should enhance their portfolios, ideally featuring heavily-trafficked applications and demonstrating expertise in Figma, which remains the industry standard. Developing a strong personal brand and connecting with local networks can also be advantageous in navigating this dynamic market.
More salary data for Jurupa Valley, CA:
Frequently Asked Questions
How much do ux designers make in Jurupa Valley, CA in 2026?
Is Jurupa Valley, CA a good place to work as a ux designer?
Can ux designers make $100K in Jurupa Valley?
What is the cost-of-living adjusted ux designer salary in Jurupa Valley?
How much does a ux designer make per hour in Jurupa Valley?
Related Pages
Compare Salaries
Career Resources
Nearby Cities in California
Written by Maria Chen, MDes
Content Lead
Maria has over 10 years of experience in user experience design. She specializes in usability testing and user research. Maria has worked with tech companies and startups.
Methodology & Data Source
Salary figures on this page are 2026 projections based on the Bureau of Labor Statistics Occupational Employment and Wage Statistics (OEWS) survey, May 2026 release. The BLS reported a median annual salary of $78,948 for ux designersin the Jurupa Valley metropolitan area. A 6.82% compound annual growth rate (CAGR), calculated from 6-year national BLS wage trends, was applied to project current 2026 compensation. Percentile ranges (P10–P90) represent the full salary distribution across experience levels and practice settings in this market.
Data Sources & Methodology
Salary data for Jurupa Valley is estimated from official BLS state-level occupational wage data (2025), adjusted for regional cost-of-living differences using BEA RPP (Regional Price Parities).
2026 figures are projected from 2025 BLS data using a compound annual growth rate (CAGR) of 6.82%, derived from historical BLS wage trends for ux designers (SOC 15-1255).
Compiled and verified by Maria Chen, MDes, a licensed ux designer with 10+ years of clinical experience. · View source data at BLS.gov