UX Designer Salary in New Hampshire: $81,993 (2026)
Quick Answer:Across New Hampshire's 16 metropolitan areas, the average median ux designer pay sits at $81,993/year heading into 2026 — a figure projected from 2025 BLS OEWS wage data for SOC 15-1255. Because New Hampshire sits at BEA RPP 107.3 (7% above the U.S. baseline), that statewide median translates to roughly $76,415 in nationally-comparable purchasing power. Highest-paying metros: Nashua ($85,879), Manchester ($85,275), Salem ($61,256).
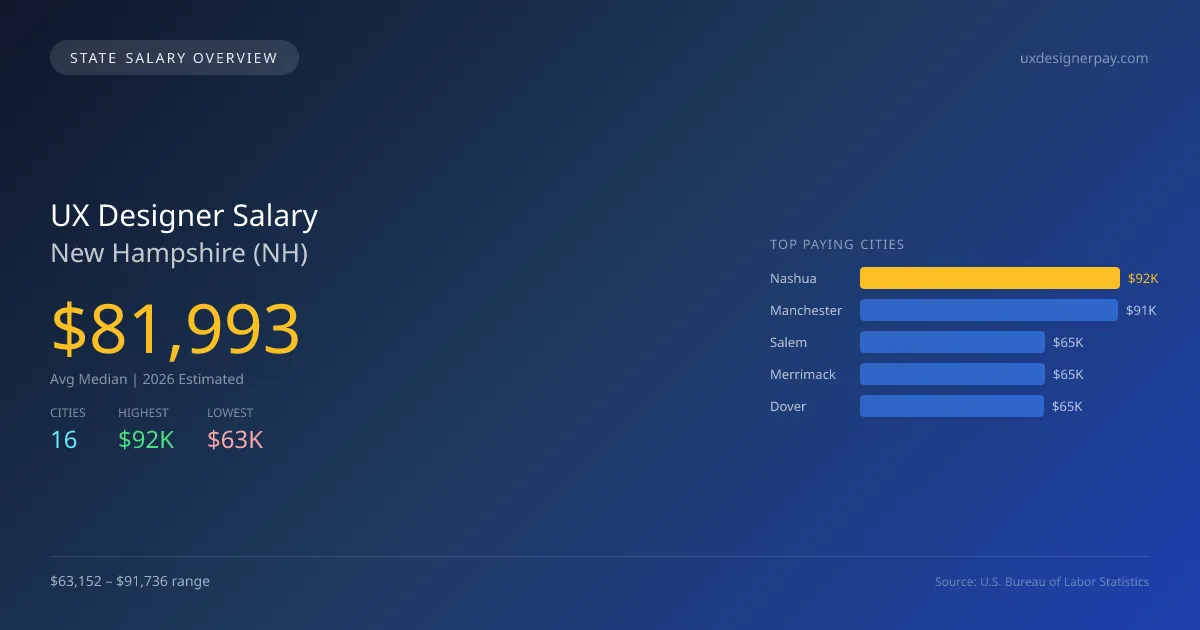
In New Hampshire, the projected average median salary for UX designers in 2026 is $81,993, which is slightly below the national median of $83,320, representing a gap of 1.6%. The salary landscape varies significantly across the state, with Nashua offering the highest average at $91,736, while Bedford presents the lowest at $63,152. This disparity is driven by local demand, the cost of living, and the concentration of tech companies, particularly in urban areas like Nashua and Manchester, where the projected salaries are $91,091. The state maintains a relatively stable job market for UX designers, with an expected growth rate of 6.82% over the coming years. This growth can be attributed to the increased emphasis on user-centered design and digital services across various sectors, including healthcare, finance, and education. New Hampshire does not have stringent licensing requirements for UX designers, allowing a broader entry into the field. However, it benefits from a well-educated workforce and proximity to larger metropolitan areas in nearby states, which can foster collaboration and expand job opportunities. As the demand for effective user interfaces continues to rise, the outlook for UX designers in New Hampshire remains positive.
New Hampshire UX Designer Salary Range
Overall salary range in New Hampshire: $36,629 (lowest entry-level) to $142,190 (highest top earner)
New Hampshire vs National Average
New Hampshire ux designers earn 1.59% less than the national median ($-1,327/year difference).
New Hampshire UX Designer Salary Distribution (2026)
UX Designer salaries in New Hampshire range from $44,509 (entry-level, 10th percentile) to $117,084 (top earners, 90th percentile), with a median of $81,993. The New Hampshire median is $1,327 below the US national median of $83,320. The average hourly rate is $39.42/hr. Approximately 245 ux designers are employed across 16 cities.
2021 BLS Actual
$67,870
2025 BLS Actual
$76,758
2026 Current Est.
$81,993
2021–2027 Growth
+29.0%
Salary Trajectory for UX Designers in New Hampshire (2021–2027)
2021–2025: actual BLS OEWS data for this metro area. 2026+: CAGR 6.82% projection.
| Year | Annual Salary | Status |
|---|---|---|
| 2021 | $67,870 | Actual |
| 2022 | $71,716 | Actual |
| 2023 | $83,118 | Actual |
| 2024 | $83,453 | Actual |
| 2025 | $76,758 | Actual |
| 2026(current) | $81,993 | Estimated |
| 2027 | $87,585 | Projected |
Based on 5 years of BLS OEWS data for the New Hampshire metropolitan area, the median ux designer salary grew 13.1% from $67,870 (2021) to $76,758 (2025). At a 6.82% compound annual growth rate, salaries are projected to reach $87,585 by 2027 — a total increase of $19,715 (29.05%) from 2021.
Note: Historical values (2021–2025) are actual BLS OEWS figures for the New Hampshire metropolitan area, sourced from annual Occupational Employment and Wage Statistics surveys. 2026–2026 figures are current estimates, and 2027 values are projections, calculated using a 6.82% CAGR derived from 5-year BLS historical data. Actual salaries may vary based on employer, experience, certifications, and local market conditions.
Top 5 Highest Paying Cities in New Hampshire
Lowest Paying Cities in New Hampshire
Best Value Cities for UX Designers in New Hampshire
When adjusted for local cost of living, these New Hampshire cities offer the most purchasing power for ux designers.
| City | Nominal Salary | CoL Index | Adjusted Salary |
|---|---|---|---|
| Manchester | $91,091 | 105.657 | $86,214 |
| Nashua | $91,736 | 107.3 | $85,495 |
| Salem | $65,434 | 107.3 | $60,982 |
| Merrimack | $65,350 | 107.3 | $60,904 |
| Dover | $64,834 | 107.3 | $60,423 |
Adjusted salary = nominal salary × (100 / CoL index). CoL index: 100 = national average. Lower index = lower cost of living.
Salary by Experience Level in New Hampshire
| Experience Level | Estimated Annual |
|---|---|
| Entry Level (0-2 years) | $44,509 |
| Mid Career (3-7 years) | $81,993 |
| Experienced (7+ years) | $117,084 |
Estimates based on BLS percentile data averaged across New Hampshire metro areas. Individual pay varies by employer, certifications, and specialization.
All 16 Cities in New Hampshire
More New Hampshire Salary Data
Explore More UX Designer Salary Data
Frequently Asked Questions
How much do ux designers make in New Hampshire in 2026?
What is the highest paying city for ux designers in New Hampshire?
How does New Hampshire ux designer pay compare to the national average?
What is the entry-level ux designer salary in New Hampshire?
How many ux designers are employed in New Hampshire?
Which New Hampshire city offers the best value for ux designers?
Written by Maria Chen, MDes
Content Lead
Maria has over 10 years of experience in user experience design. She specializes in usability testing and user research. Maria has worked with tech companies and startups.
Methodology & Data Source
Statewide salary figures on this page are 2026 projections based on the Bureau of Labor Statistics Occupational Employment and Wage Statistics (OEWS) survey, May 2026 release. A 6.82% compound annual growth rate (CAGR), derived from 6-year national BLS wage trends, was applied to each metro area's reported salary to estimate current 2026 ux designer compensation across New Hampshire. State averages are employment-weighted across 16 metro areas — larger metro areas with more ux designerscontribute proportionally more to the average, producing figures that better reflect typical compensation. Individual pay varies by city, employer, certifications, and experience.
Data Sources & Methodology
Source: BLS, OEWS, 5-year dataset (–). Per-city data from annual BLS metropolitan area surveys.
2026 figures are projected from 2025 BLS data using a compound annual growth rate (CAGR) of 6.82%, derived from historical BLS wage trends for ux designers (SOC 15-1255).
Compiled and verified by Maria Chen, MDes, a licensed ux designer with 10+ years of clinical experience. · View source data at BLS.gov