UX Designer Salary in Tennessee: $50,211 (2026)
Quick Answer:Across Tennessee's 30 metropolitan areas, the average median ux designer pay sits at $50,211/year heading into 2026 — a figure projected from 2025 BLS OEWS wage data for SOC 15-1255. Because Tennessee sits at BEA RPP 91.8 (8% below the U.S. baseline), that statewide median translates to roughly $54,696 in nationally-comparable purchasing power. Highest-paying metros: Nashville ($47,633), Franklin ($47,059), Memphis ($46,845).
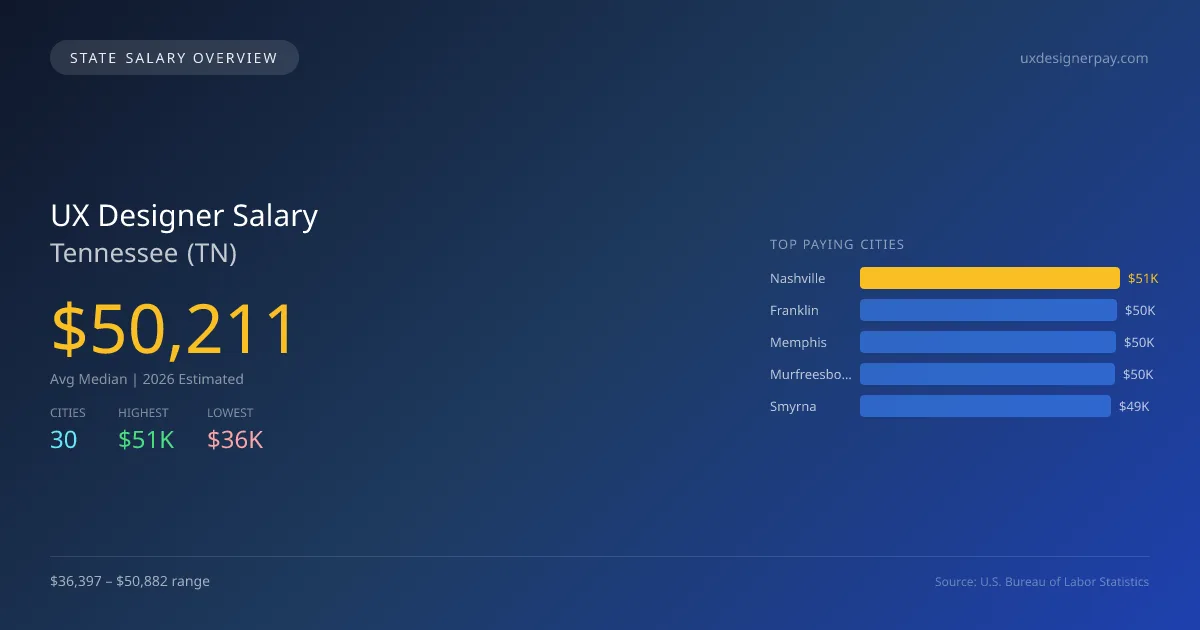
In 2026, the average median salary for UX designers in Tennessee is projected to be $50,211, significantly below the national median of $83,320, reflecting a gap of 39.7%. Nashville leads the state with a salary of $50,882, while Kingsport presents the lowest figure at $36,397, highlighting a city-based salary variance of $14,485. This disparity is influenced by factors such as the concentration of technology jobs, local cost of living, and industry demand specific to metropolitan areas. Tennessee does not have extensive state licensing requirements for UX designers, but understanding the scope of practice laws and the local job market dynamics remains crucial. The ongoing demand for digital experiences and user-centered design is driving growth, with an anticipated annual CAGR of 6.82%. With a total of 3,310 UX designers employed across the state’s various metro areas, cities such as Franklin and Memphis also reflect competitive salaries, reported at $50,268 and $50,040 respectively. Murfreesboro and Smyrna follow closely with figures of $49,980 and $49,170. This indicates a reasonable job market outlook for UX designers, particularly in urban hubs where technology and design initiatives are expanding.
Tennessee UX Designer Salary Range
Overall salary range in Tennessee: $26,068 (lowest entry-level) to $94,760 (highest top earner)
Tennessee vs National Average
Tennessee ux designers earn 39.74% less than the national median ($-33,109/year difference).
Tennessee UX Designer Salary Distribution (2026)
UX Designer salaries in Tennessee range from $42,366 (entry-level, 10th percentile) to $64,855 (top earners, 90th percentile), with a median of $50,211. The Tennessee median is $33,109 below the US national median of $83,320. The average hourly rate is $24.14/hr. Approximately 3,310 ux designers are employed across 30 cities.
2021 BLS Actual
$50,512
2025 BLS Actual
$47,005
2026 Current Est.
$50,211
2021–2027 Growth
+6.2%
Salary Trajectory for UX Designers in Tennessee (2021–2027)
2021–2025: actual BLS OEWS data for this metro area. 2026+: CAGR 6.82% projection.
| Year | Annual Salary | Status |
|---|---|---|
| 2021 | $50,512 | Actual |
| 2022 | $55,516 | Actual |
| 2023 | $63,537 | Actual |
| 2024 | $52,818 | Actual |
| 2025 | $47,005 | Actual |
| 2026(current) | $50,211 | Estimated |
| 2027 | $53,635 | Projected |
Based on 5 years of BLS OEWS data for the Tennessee metropolitan area, the median ux designer salary grew -6.9% from $50,512 (2021) to $47,005 (2025). At a 6.82% compound annual growth rate, salaries are projected to reach $53,635 by 2027 — a total increase of $3,123 (6.18%) from 2021.
Note: Historical values (2021–2025) are actual BLS OEWS figures for the Tennessee metropolitan area, sourced from annual Occupational Employment and Wage Statistics surveys. 2026–2026 figures are current estimates, and 2027 values are projections, calculated using a 6.82% CAGR derived from 5-year BLS historical data. Actual salaries may vary based on employer, experience, certifications, and local market conditions.
Top 5 Highest Paying Cities in Tennessee
Lowest Paying Cities in Tennessee
| City | Median Salary |
|---|---|
| Kingsport | $36,397 |
| Chattanooga | $39,842 |
| Tullahoma | $44,946 |
| Sevierville | $45,926 |
| Maryville | $46,192 |
Best Value Cities for UX Designers in Tennessee
When adjusted for local cost of living, these Tennessee cities offer the most purchasing power for ux designers.
| City | Nominal Salary | CoL Index | Adjusted Salary |
|---|---|---|---|
| Franklin | $50,268 | 91.8 | $54,758 |
| Murfreesboro | $49,980 | 91.8 | $54,444 |
| Memphis | $50,040 | 92.179 | $54,286 |
| Smyrna | $49,170 | 91.8 | $53,562 |
| Jackson | $49,078 | 91.8 | $53,462 |
Adjusted salary = nominal salary × (100 / CoL index). CoL index: 100 = national average. Lower index = lower cost of living.
Salary by Experience Level in Tennessee
| Experience Level | Estimated Annual |
|---|---|
| Entry Level (0-2 years) | $42,366 |
| Mid Career (3-7 years) | $50,211 |
| Experienced (7+ years) | $64,855 |
Estimates based on BLS percentile data averaged across Tennessee metro areas. Individual pay varies by employer, certifications, and specialization.
All 30 Cities in Tennessee
| # | City | Median Salary |
|---|---|---|
| 1 | Nashville | $50,882 |
| 2 | Franklin | $50,268 |
| 3 | Memphis | $50,040 |
| 4 | Murfreesboro | $49,980 |
| 5 | Smyrna | $49,170 |
| 6 | Jackson | $49,078 |
| 7 | Johnson City | $48,997 |
| 8 | Bartlett | $48,925 |
| 9 | Collierville | $48,755 |
| 10 | Knoxville | $48,646 |
| 11 | Spring Hill | $48,381 |
| 12 | Morristown | $48,169 |
| 13 | Clarksville | $48,109 |
| 14 | Lebanon | $47,731 |
| 15 | Oak Ridge | $47,728 |
| 16 | Cleveland | $47,512 |
| 17 | Columbia | $47,408 |
| 18 | Germantown | $47,347 |
| 19 | Hendersonville | $47,252 |
| 20 | Gallatin | $47,170 |
| 21 | Brentwood | $46,924 |
| 22 | Shelbyville | $46,560 |
| 23 | Mount Juliet | $46,557 |
| 24 | La Vergne | $46,460 |
| 25 | Cookeville | $46,222 |
| 26 | Maryville | $46,192 |
| 27 | Sevierville | $45,926 |
| 28 | Tullahoma | $44,946 |
| 29 | Chattanooga | $39,842 |
| 30 | Kingsport | $36,397 |
More Tennessee Salary Data
Compare Cities in Tennessee
View all comparisons →Explore More UX Designer Salary Data
Frequently Asked Questions
How much do ux designers make in Tennessee in 2026?
What is the highest paying city for ux designers in Tennessee?
How does Tennessee ux designer pay compare to the national average?
What is the entry-level ux designer salary in Tennessee?
How many ux designers are employed in Tennessee?
Which Tennessee city offers the best value for ux designers?
Written by Maria Chen, MDes
Content Lead
Maria has over 10 years of experience in user experience design. She specializes in usability testing and user research. Maria has worked with tech companies and startups.
Methodology & Data Source
Statewide salary figures on this page are 2026 projections based on the Bureau of Labor Statistics Occupational Employment and Wage Statistics (OEWS) survey, May 2026 release. A 6.82% compound annual growth rate (CAGR), derived from 6-year national BLS wage trends, was applied to each metro area's reported salary to estimate current 2026 ux designer compensation across Tennessee. State averages are employment-weighted across 30 metro areas — larger metro areas with more ux designerscontribute proportionally more to the average, producing figures that better reflect typical compensation. Individual pay varies by city, employer, certifications, and experience.
Data Sources & Methodology
Source: BLS, OEWS, 5-year dataset (–). Per-city data from annual BLS metropolitan area surveys.
2026 figures are projected from 2025 BLS data using a compound annual growth rate (CAGR) of 6.82%, derived from historical BLS wage trends for ux designers (SOC 15-1255).
Compiled and verified by Maria Chen, MDes, a licensed ux designer with 10+ years of clinical experience. · View source data at BLS.gov